
THE latest data showing the number of new Covid-19 cases in each local authority has been published – revealing a stable rate in St Helens but growth in neighbouring Knowsley.
The figures, released by Press Association through Public Health England, show the rate of new cases in each area, based on tests that have been carried out both in laboratories 'pillar 1' of the Government's testing programme and in the wider community 'pillar 2'.
This data reveals the number of cases per 100,000 population, for the week ending Sunday, June 28.
READ>These figures show St Helens death rate remained higher than normal in May
The rate in St Helens is stable, remaining at 6.7 per 100,000 residents for a consecutive week.
However, in Knowsley it more than trebled in the last week of June, new figures reveal.
Liverpool's rate has increased, while Warrington's has decreased.

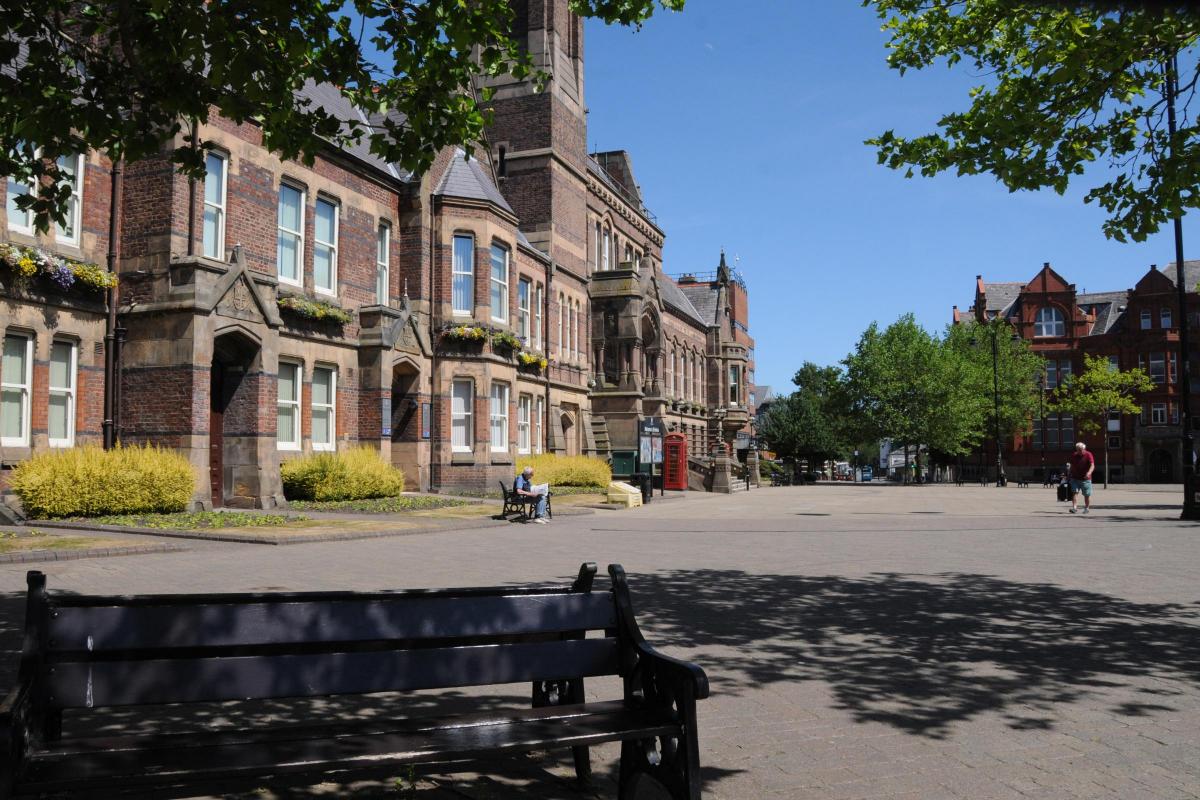
A man walks through St Helens town centre wearing a face mask
Statistics published by Public Health England on Thursday show the Knowsley borough saw the fourth fastest rise in coronavirus infections of any local authority in England in the week ending June 28.
Although the absolute number of cases remains relatively low, the speed with which the rate increased from will be of concern .
With 20.1 cases per 100,000 residents, Knowsley now has the 12th highest rate of coronavirus cases in England, up from 66th the previous week.
These figures include both Pillar 1 tests carried out in hospitals and the Pillar 2 tests carried out in the community.
Although Knowsley has risen, it is still a long way off the infection rate in Leicester, which was placed back into lockdown this week following a spike in reported cases of coronavirus.
Leicester’s infection rate is still seven times higher than Knowsley’s, at 141 cases per 100,000 residents.
A spokesperson for Knowsley Council said daily figures provided to the local authority showed residents were “responding well to the need to get tested if they are showing any of the symptoms of COVID-19”.
The spokesperson added: “It’s vitally important anyone displaying symptoms of coronavirus books a test to see if they have the virus.
“More dates have been added for the mobile testing unit here in Knowsley, making it easier for our residents to be tested locally and to keep up the great response we’ve had so far.”
Here is the full list, showing the number of cases per 100,000 population and in brackets, the equivalent figure for the previous week:
Leicester 141.3 (140.2)
Bradford 45.8 (69.4)
Barnsley 35.1 (54.7)
Rochdale 35.0 (53.6)
Oldham 30.1 (38.6)
Kirklees 26.2 (30.3)
Rotherham 26.1 (33.6)
Sheffield 24.4 (20.6)
Bolton 23.5 (15.8)
Doncaster 21.3 (17.4)
Blackburn with Darwen 20.8 (32.9)
Knowsley 20.1 (6.0)
Peterborough 18.9 (27.9)
Bedford 18.1 (42.0)
Manchester 17.5 (21.6)
Leicestershire 17.3 (20.8)
Tameside 16.9 (33.3)
Luton 15.0 (26.6)
Calderdale 14.8 (12.4)
Stoke-on-Trent 14.1 (18.0)
Blackpool 13.6 (10.8)
Derby 12.8 (24.5)
Hammersmith & Fulham 12.4 (5.9)
Leeds 11.7 (19.8)
Cheshire East 11.3 (16.0)
Kent 10.0 (13.5)
Northamptonshire 9.9 (14.9)
Cheshire West & Chester 9.7 (12.3)
Hounslow 9.2 (7.4)
Wakefield 9.0 (18.6)
Slough 8.7 (13.4)
Nottingham 8.5 (10.6)
Wirral 8.4 (19.2)
Southend-on-Sea 8.2 (20.8)
Staffordshire 7.9 (9.4)
Salford 7.9 (10.2)
Liverpool 7.7 (6.3)
Wolverhampton 7.6 (9.9)
Lancashire 7.4 (15.0)
Shropshire 7.2 (13.7)
Thurrock 7.0 (12.2)
Swindon 6.8 (10.4)
Ealing 6.7 (4.1)
St. Helens 6.7 (6.7)
Derbyshire 6.5 (9.7)
Solihull 6.5 (4.7)
Stockport 6.5 (12.3)
Birmingham 6.5 (9.6)
Hartlepool 6.4 (4.3)
Kensington & Chelsea 6.4 (7.7)
Middlesbrough 6.4 (7.8)
Bury 6.3 (13.2)
Halton 6.2 (6.2)
Hillingdon 5.9 (2.6)
Merton 5.8 (4.4)
Warrington 5.7 (9.1)
Barking & Dagenham 5.7 (1.4)
Central Bedfordshire 5.6 (15.9)
Warwickshire 5.6 (10.3)
Stockton-on-Tees 5.6 (14.7)
Sandwell 5.5 (7.3)
Brent 5.4 (5.1)
Havering 5.4 (1.9)
Nottinghamshire 5.4 (12.6)
Redcar & Cleveland 5.1 (0.7)
Telford & Wrekin 5.1 (8.4)
North Yorkshire 5.0 (13.8)
Sefton 4.7 (8.4)
East Riding of Yorkshire 4.7 (14.1)
Waltham Forest 4.7 (5.4)
Westminster 4.7 (5.1)
Medway 4.7 (6.1)
Wigan 4.6 (5.5)
County Durham 4.6 (5.1)
East Sussex 4.5 (9.0)
Oxfordshire 4.4 (5.1)
Milton Keynes 4.1 (10.8)
Wandsworth 4.0 (2.8)
Hull 3.8 (22.6)
Trafford 3.8 (10.2)
North Somerset 3.7 (1.4)
Cambridgeshire 3.7 (5.1)
Newcastle upon Tyne 3.7 (5.3)
Cumbria 3.6 (5.8)
Enfield 3.6 (2.7)
Worcestershire 3.6 (5.7)
Buckinghamshire 3.5 (6.1)
Essex 3.5 (5.8)
North Lincolnshire 3.5 (4.7)
Bexley 3.2 (4.5)
Walsall 3.2 (4.6)
Reading 3.1 (1.8)
Richmond upon Thames 3.1 (1.0)
Lincolnshire 3.0 (5.7)
Wokingham 3.0 (0.6)
Haringey 3.0 (2.6)
Surrey 2.9 (3.7)
North Tyneside 2.9 (4.9)
West Sussex 2.9 (3.3)
Croydon 2.9 (1.6)
Harrow 2.8 (1.6)
Greenwich 2.5 (3.1)
Brighton & Hove 2.4 (5.2)
Hertfordshire 2.4 (4.6)
Redbridge 2.3 (3.6)
Plymouth 2.3 (1.5)
Northumberland 2.2 (3.4)
Dudley 2.2 (3.7)
Isle of Wight 2.1 (2.8)
Bristol 1.9 (1.9)
York 1.9 (6.7)
North East Lincolnshire 1.9 (1.9)
Sunderland 1.8 (1.8)
Kingston upon Thames 1.7 (1.1)
Newham 1.7 (3.4)
Lewisham 1.7 (2.0)
Bracknell Forest 1.6 (4.1)
Southwark 1.6 (3.5)
Herefordshire 1.6 (2.1)
Norfolk 1.6 (4.3)
Barnet 1.5 (2.3)
Sutton 1.5 (2.0)
Hackney 1.4 (2.5)
Cornwall & Isles of Scilly 1.4 (0.7)
Wiltshire 1.4 (1.2)
Coventry 1.4 (5.7)
West Berkshire 1.3 (0.0)
Dorset 1.1 (1.1)
Bournemouth, Christchurch & Poole 1.0 (1.3)
Gloucestershire 1.0 (0.6)
Darlington 0.9 (4.7)
Tower Hamlets 0.9 (2.8)
Suffolk 0.9 (1.5)
Somerset 0.9 (4.7)
Islington 0.8 (2.9)
South Gloucestershire 0.7 (0.4)
South Tyneside 0.7 (0.0)
Windsor & Maidenhead 0.7 (2.0)
Bromley 0.6 (2.1)
Gateshead 0.5 (3.5)
Hampshire 0.4 (1.2)
Southampton 0.4 (5.5)
Camden 0.4 (1.9)
Devon 0.4 (1.0)
Lambeth 0.3 (0.9)
Bath & North East Somerset 0.0 (1.0)
City of London 0.0 (0.0)
Portsmouth 0.0 (0.9)
Rutland 0.0 (2.5)
Torbay 0.0 (0.7)


Comments: Our rules
We want our comments to be a lively and valuable part of our community - a place where readers can debate and engage with the most important local issues. The ability to comment on our stories is a privilege, not a right, however, and that privilege may be withdrawn if it is abused or misused.
Please report any comments that break our rules.
Read the rules hereLast Updated:
Report this comment Cancel